Playground Map
A toy project based on a joke that got taken too far. My girlfriend noted that she had liked to visit every playground in her city as a kid. As a fun little gift, I designed a custom map of local playgrounds for her.
Making the map consisted of two main steps: getting the data and designing the map.
Getting Data
The first step for this project was to get a listing of all playgrounds in the city. The local tourist info gives out children’s maps showing public playgrounds amongst other things. This was a good starting point but I needed the data in a machine-readable format for display on a digital map. I checked OpenStreetMap and its playground coverage in the area looked quite good.
To extract the map data from OpenStreetMap, I used Overpass Turbo. It allows you to specify queries for the data and output format you like, in this case JSON. This is the Overpass Turbo query I used for public playgrounds in Braunschweig, Germany:
[out:json][timeout:25];
{{geocodeArea:Braunschweig}}->.searchArea;
(
    node["leisure"="playground"]["access"!="private"](area.searchArea);
    way["leisure"="playground"]["access"!="private"](area.searchArea);
    relation["leisure"="playground"]["access"!="private"](area.searchArea);
);
out body;
>;
out skel qt;
Validating Data
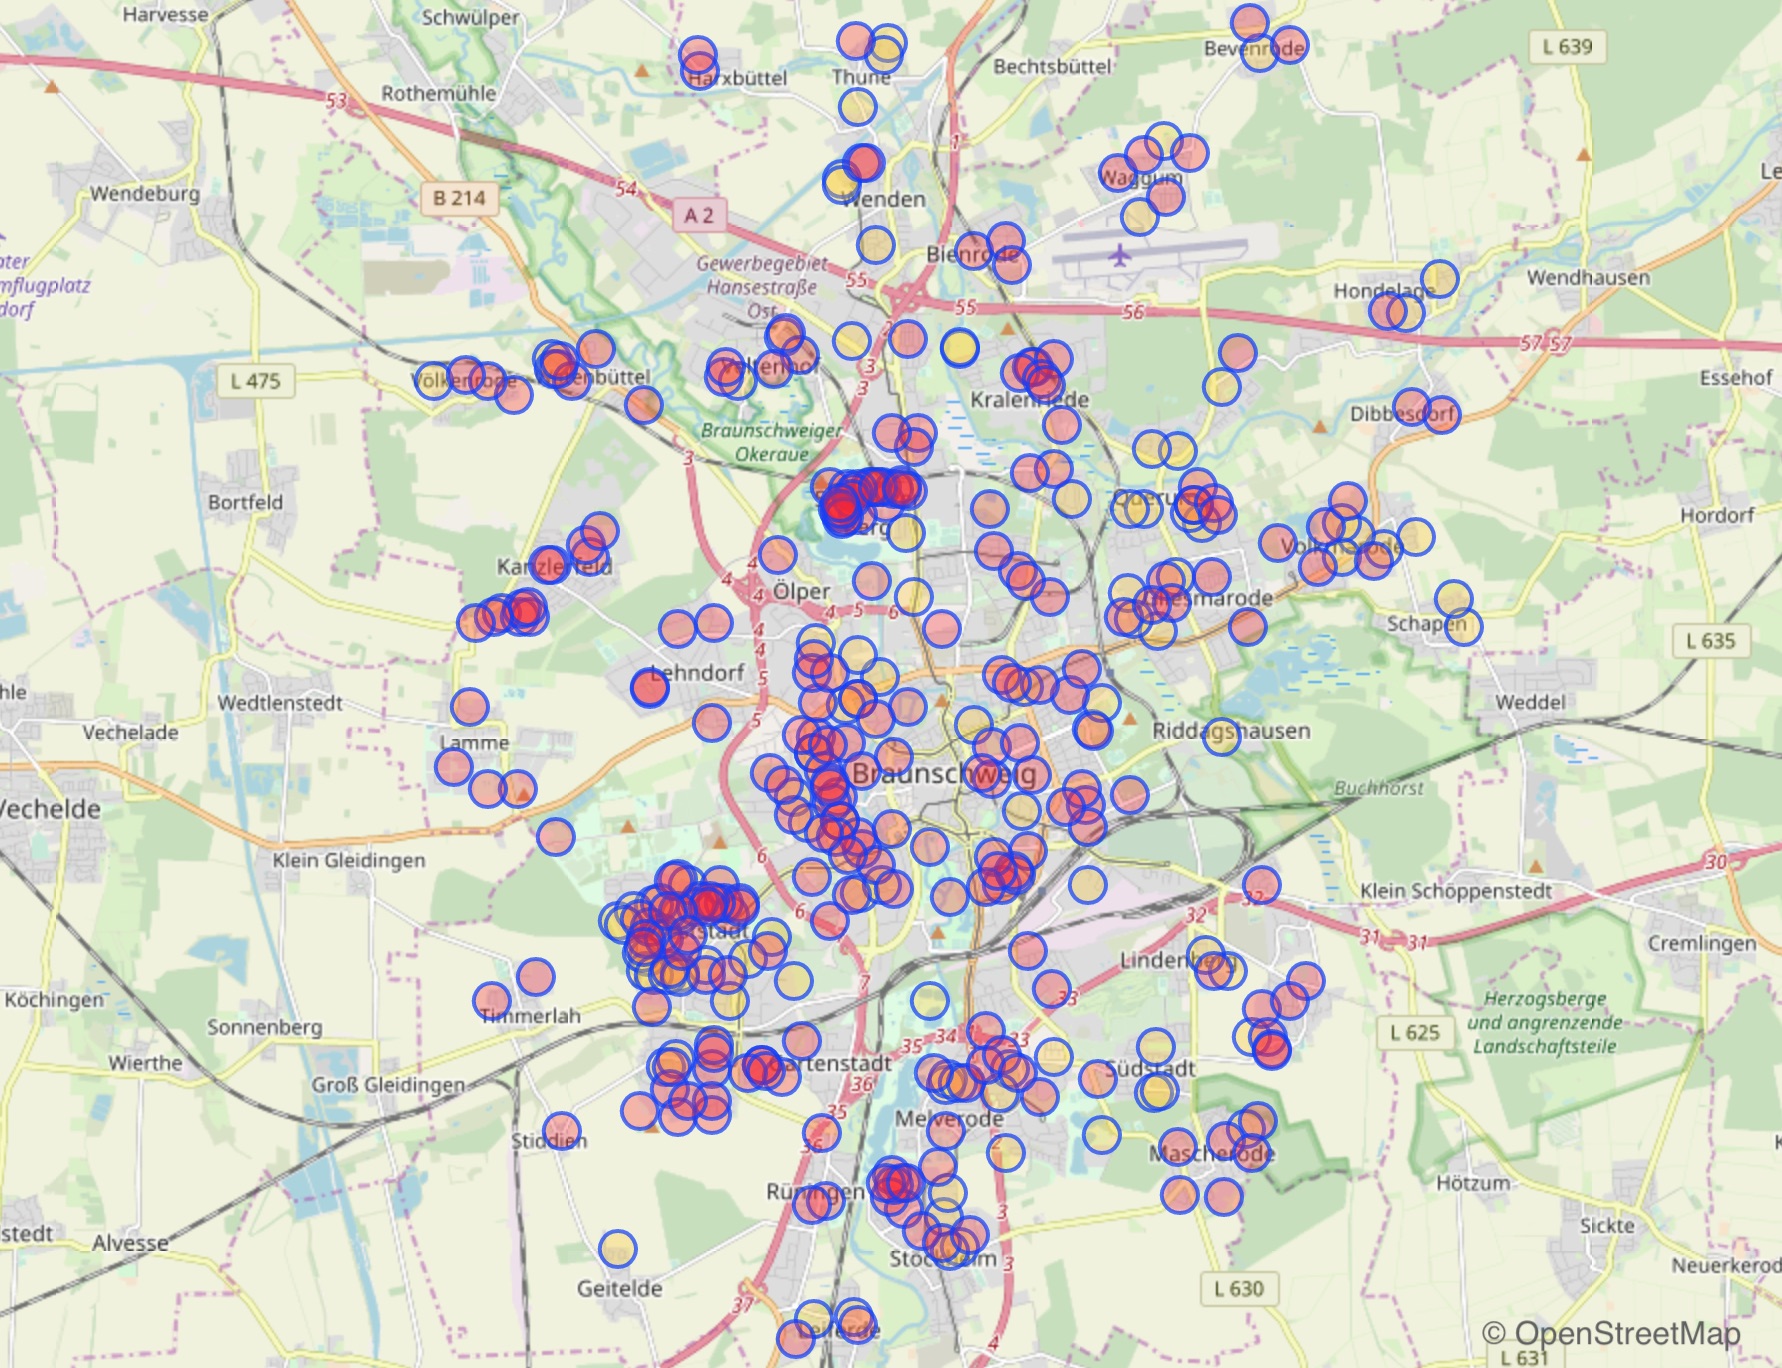
The result contained 360 playgrounds, too many for the map I envisioned. The printed map would be too crowded and navigating to and marking off visited locations would be difficult. I decided to hand-filter playgrounds by a few criteria.
From looking at satellite imagery, I found that many locations marked as playgrounds were simple sandpits. I excluded many of these. Additionally, I removed playgrounds tagged in OpenStreetMap that were not present in the children’s map provided by the local government.
Going through every single playground in the original set was quite time-consuming. I thought about automating the decision process—like only including playgrounds with a minimum size or an assigned name—but in the end the manual process guaranteed the best results.
That left me with 161 playgrounds. Since I’d be showing only the districts around the city center, the final map would contain even fewer than that. Great!
Designing the Map
Now for the fun part, designing the map.
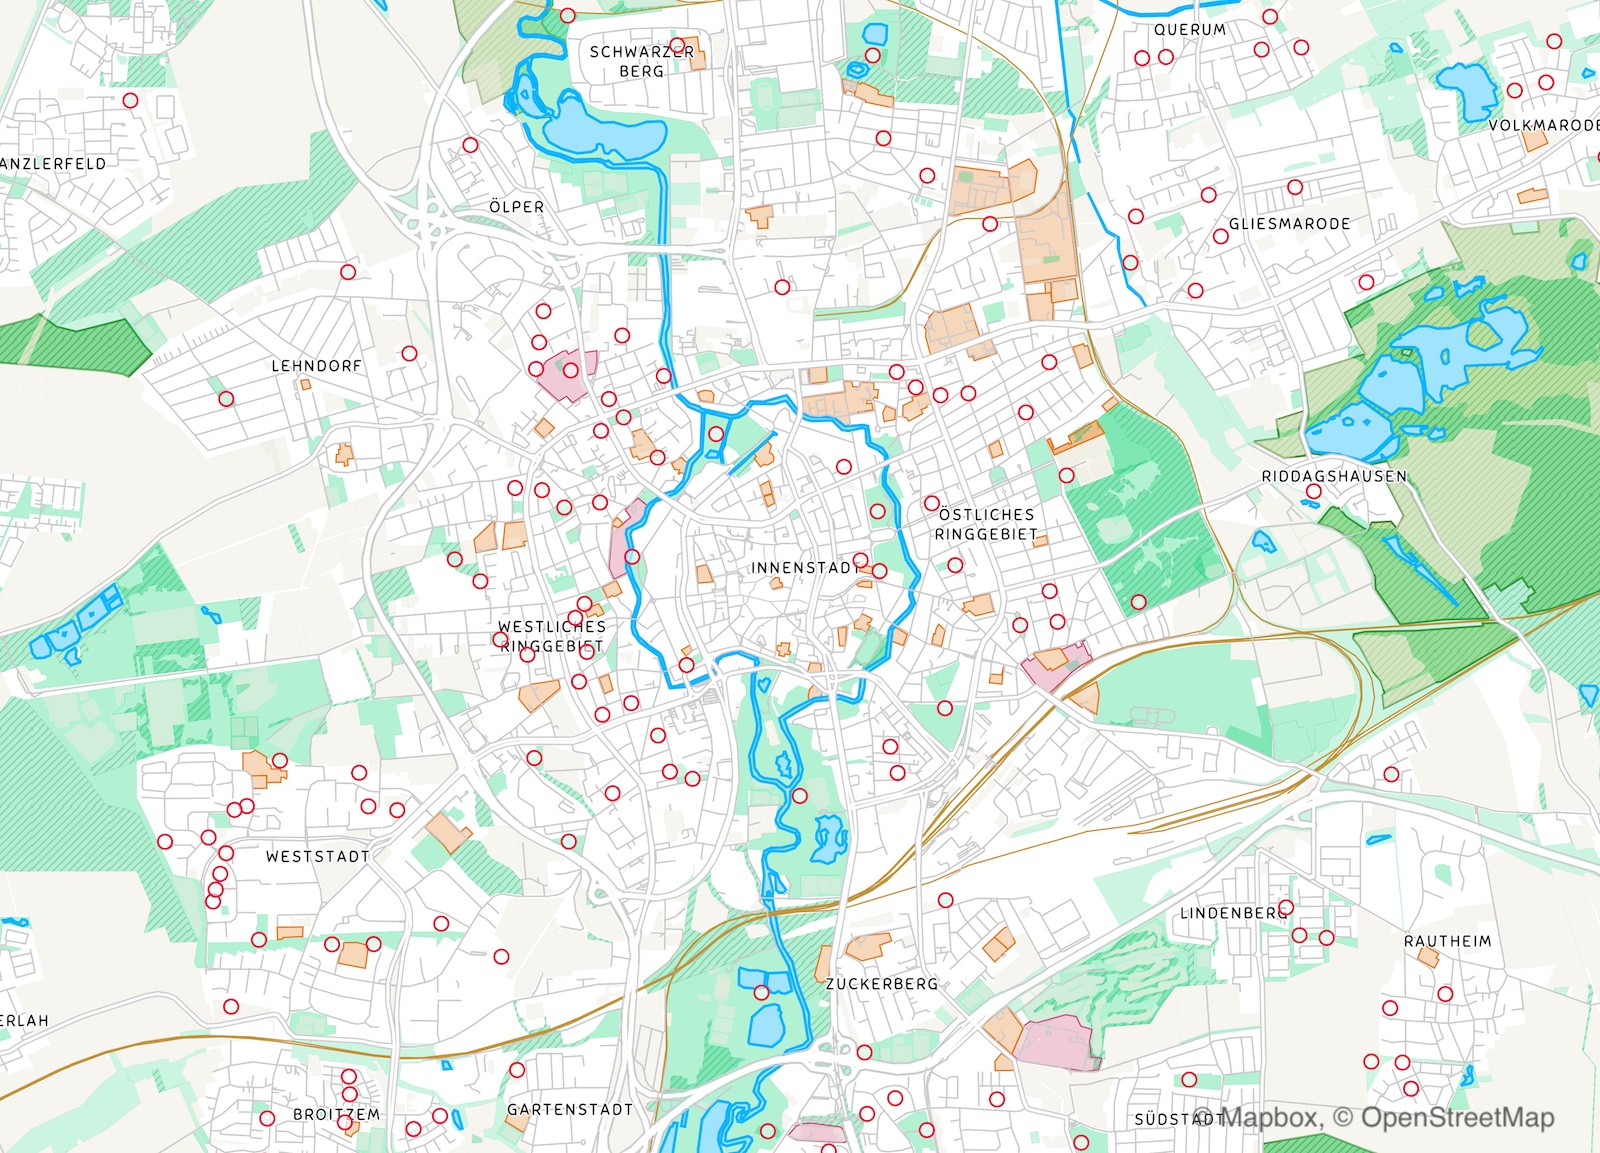
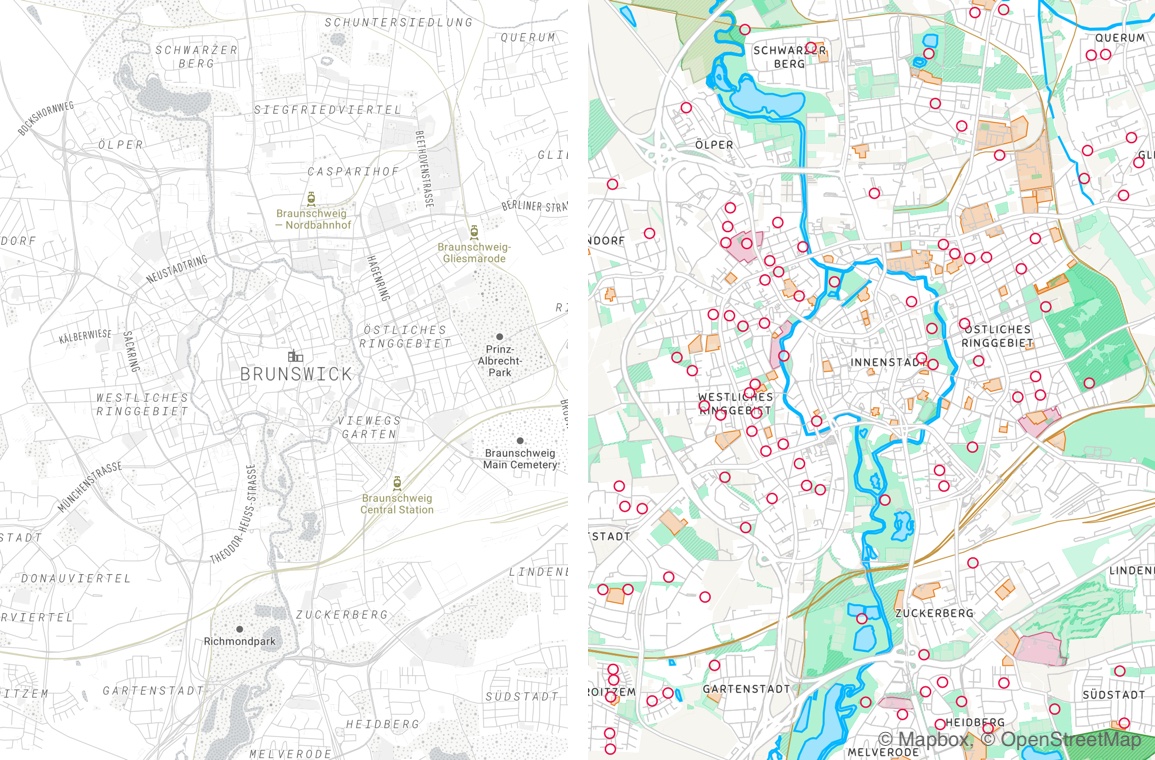
In the spirit of playing and playgrounds, I wanted the map to be lighthearted and fun, taking cues from children’s maps. The street network should appear muted but other landmark features like parks and lakes I wanted to be bold. This lets the playground locations stand out but still allows the map to be used for navigation. Finally, I highlighted the city district names to give an additional navigational context.
To style the map, I used Mapbox Studio. It’s a powerful tool that gives you full control on how you style certain map elements. I started with their new Minimo style which provided a good basis for my map design.
You can try out an interactive version of the map here.
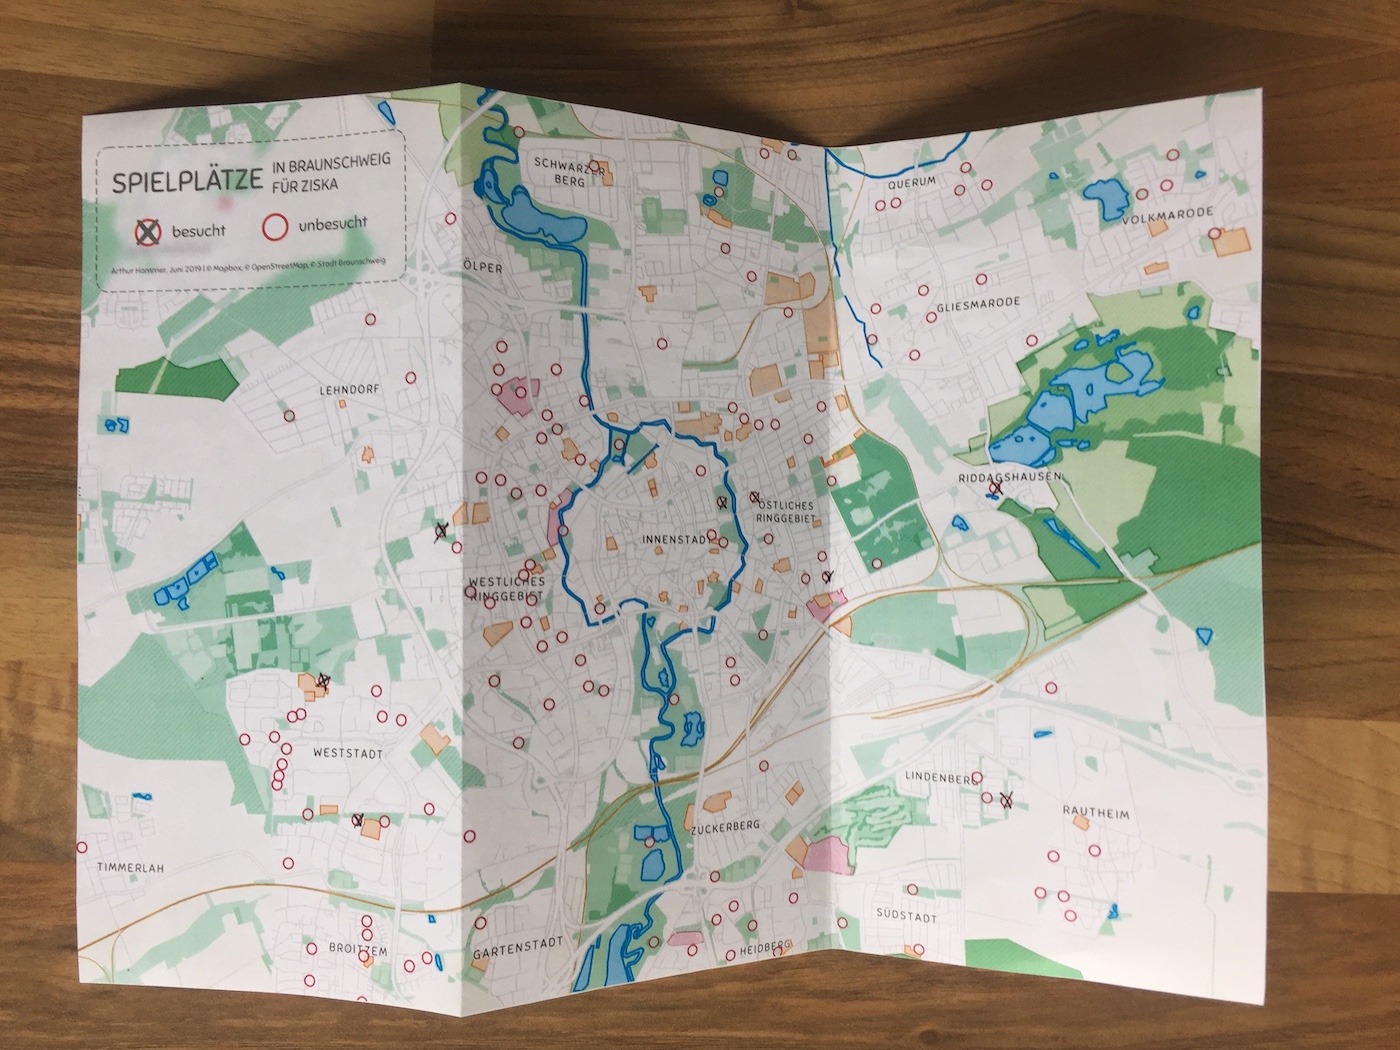
Printing
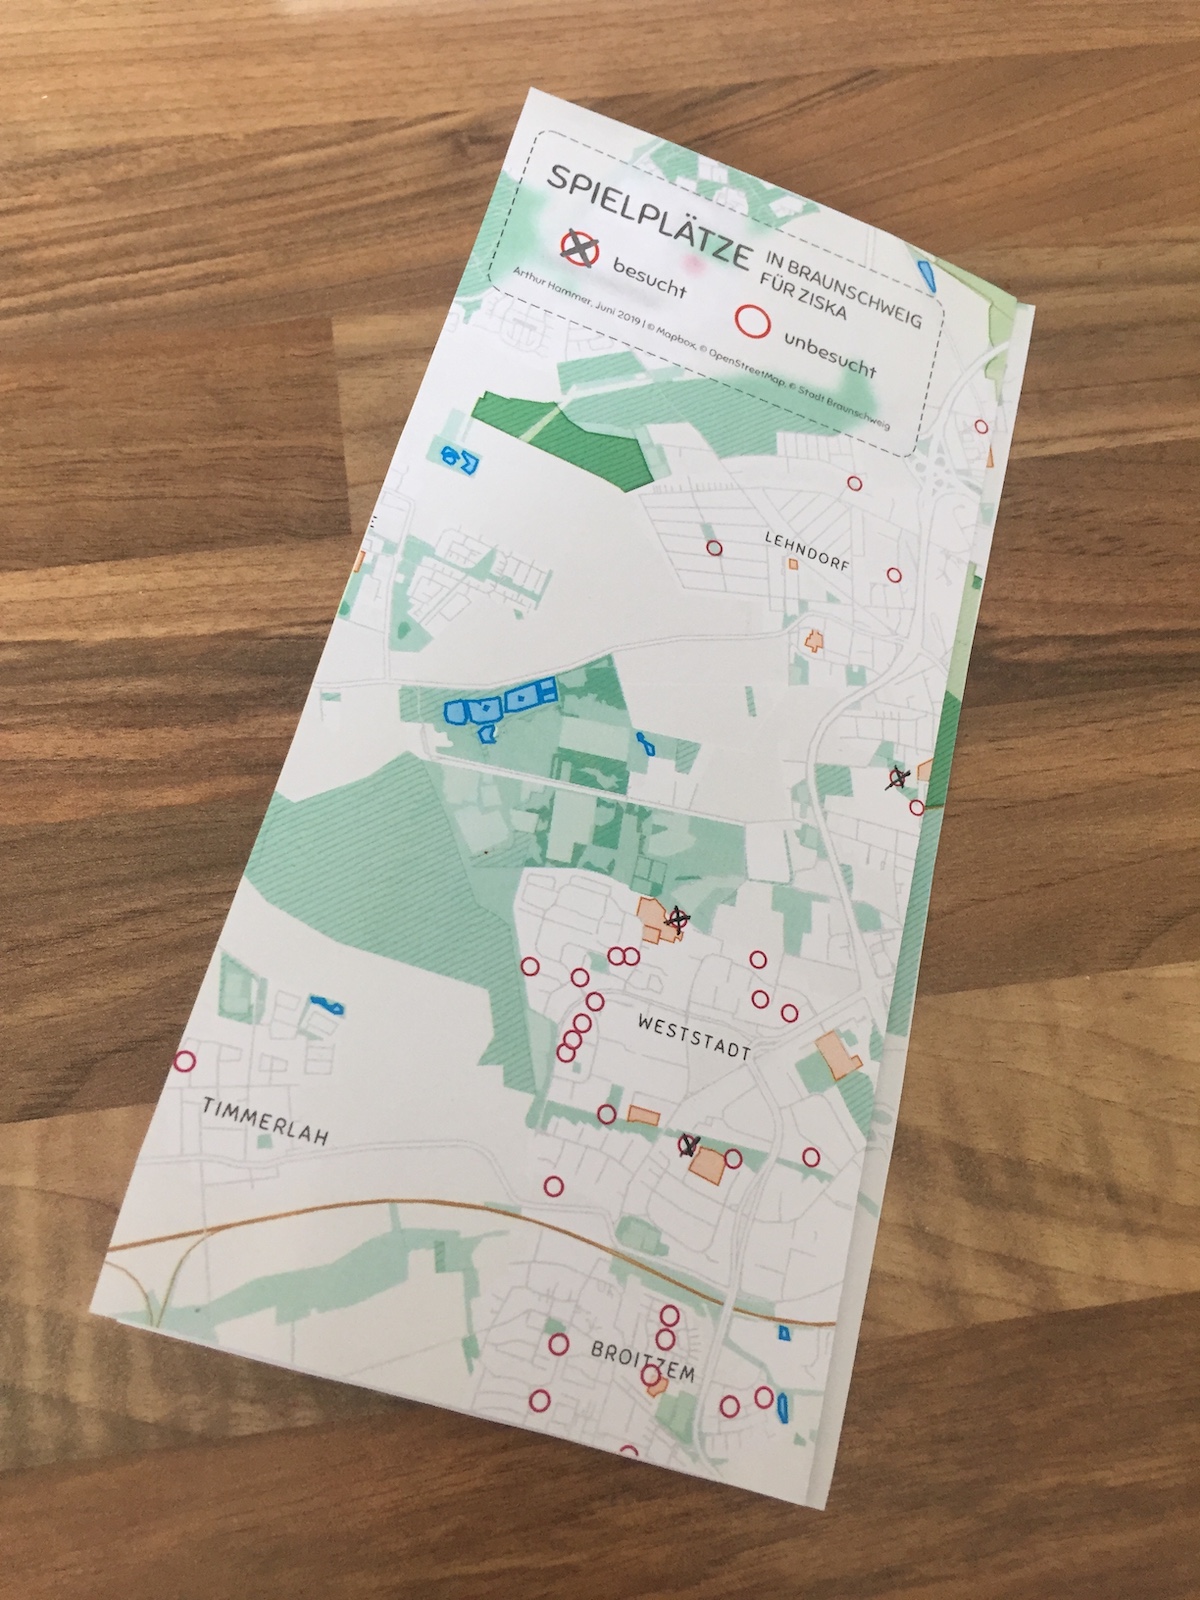
Initially, I planned to make a high-quality print and frame the map. During the process I decided against it for two reasons: First, a framed map on the wall can’t be readily used for navigating to playgrounds and crossing off visited ones. Second, frames come with an obligation to hang them up the wall. I don’t like that. In the end, I settled for a DIN A4 printout folded into a little flyer.
I’m quite pleased with the result and my girlfriend is too.